Learn Excel, SQL, Power BI and Tableau the way companies actually use them. Live projects, industry examples, and guided mentorship.

A practical, industry-aligned program designed to help you build Business Analysis skills and grow confidently in your career.
Learn tools and concepts that professionals use daily at work. Focus on practical application, not just theory.
Work on real-world scenarios and guided projects that mirror actual workplace tasks—so you can apply what you learn immediately.
No prior experience required. We start from the fundamentals and gradually move to advanced, job-ready skills with clear explanations.
Learn best practices, structured workflows, and problem-solving methods followed in real organizations—designed to make you workplace-ready.
This course prepares you for high-demand, well-paying roles in Business Analysis
Salary: ₹6-10 LPA
Demand: Very High
Work with data to create reports, dashboards, and insights that support business decisions.
Salary: ₹6-12 LPA
Demand: High
Bridge the gap between business teams and data by translating requirements into actionable insights.
Salary: ₹6-9 LPA
Demand: High
Analyze operational data to improve efficiency, processes, and performance across teams.
Salary: ₹6-14 LPA
Demand: High
Use data to track financial performance, budgets, forecasts, and business profitability.
Salary: ₹6-10 LPA
Demand: High
Analyze sales data, customer trends, and performance metrics to help teams close better deals.
Salary: ₹5-8 LPA
Demand: High
Create structured reports and dashboards used by management for regular decision-making.
Companies across industries actively recruit Business Analysts
Expected job growth in Business Analysis roles by 2028
Job openings annually in India for Business Analysts
Average starting salary for entry-level roles
Learn the most in-demand tools used by professionals to analyze data, build reports, and drive business decisions.

Master data cleaning, formulas, pivot tables, dashboards, and automation techniques.

Learn to extract, filter, and analyze data using structured queries.

Build interactive dashboards and business intelligence reports.

Create impactful data visualizations and storytelling dashboards.
Designed for individuals and professionals across functions who want to work smarter with data and grow in their careers.
Learn how to work with real business data, create reports, and build dashboards—skills expected in entry-level roles across companies.
Analyze sales performance, targets vs achievement, customer trends, and monthly reports to support decision-making.
Track KPIs, monitor process efficiency, analyze operational data, and create performance dashboards for management reviews.
Work with budgets, P&L data, forecasts, variance analysis, and financial reports using structured analytics.
Analyze hiring data, attrition trends, performance metrics, and workforce reports to support HR decisions.
Move into data-driven roles by learning tools and workflows used across business, analytics, and reporting teams.
A structured learning path with hands-on projects


A structured, step-by-step journey from beginner to job-ready analyst
Duration: 1.5 – 2 Months
Focus: Build strong fundamentals in working with business data
👉 Outcome: Confidence in handling data and building reports using Excel.
Duration: 2 – 3 Months
Focus: Work with databases and structured data
👉 Outcome: Ability to work with databases and answer business questions using data.
Duration: 1 – 2 Months
Focus: Transform data into interactive dashboards
👉 Outcome: Create professional dashboards used by management and teams.
Duration: 1 – 2 Months
Focus: Advanced visualization and data storytelling
👉 Outcome: Master visual storytelling and executive-level presentations.
Duration: 1 – 2 Weeks
Focus: Position yourself as an analyst and apply strategically
👉 Outcome: A strong analyst CV + a clear, repeatable job application strategy.
Duration: 1 – 2 Weeks
Focus: Clear interviews with confidence and professionalism
👉 Outcome: Interview confidence, structured preparation, and readiness to convert opportunities.
✅ 20+ industry projects
✅ 1 Capstone Project
✅ Job-ready analytics skillset
✅ Optimized CV + job search playbook
Industry-relevant projects that demonstrate core analytics skills for analyst roles
Analyze ecommerce order and revenue data to identify sales patterns, top customers, and revenue optimization strategies.
Tools: SQL, Excel, Power BI
Detect suspicious transactions using analytics techniques to flag potential fraud in banking datasets.
Tools: SQL, Excel, Power BI/Tableau
Explore retail sales data to balance stock levels, forecast demand, and improve inventory efficiency.
Tools: Excel, Power BI
Measure the effectiveness of marketing campaigns, understand customer engagement, and calculate ROI.
Tools: SQL, Power BI, Tableau
Optimize transportation routes and improve delivery performance through data exploration and visualization.
Tools: SQL, Power BI
Clean, prepare, and analyze large retail datasets to draw actionable business insights.
Tools: Excel, Tableau
Build interactive visual dashboards showing sales trends across regions for better strategic decisions.
Tools: Tableau, Power BI
Track delivery times and performance metrics from quick commerce datasets (e.g., Zomato, Swiggy).
Tools: Excel, Tableau
Uncover insights in healthcare data to analyze patient visits, treatment trends, and hospital resource usage.
Tools: SQL, Power BI
Study crop production and cost datasets to evaluate agricultural performance and recommend improvements.
Tools: Excel, Power BI
Our learners work at leading organizations across industries


Our learners come from diverse backgrounds and move into data-driven roles across industries with confidence and clarity.
With consistent learning, project work, and structured job preparation.
Driven by upskilling, role transitions, and improved data proficiency.
Across IT services, startups, consulting firms, BFSI, SaaS, and corporates.
We don't just teach tools — we help you prepare, apply, and succeed.
Get structured feedback to build an analyst-ready CV aligned with job roles and ATS keywords.
Learn how to present your 20+ projects clearly to recruiters and hiring managers.
Role-specific interview guidance, mock questions, and preparation strategies for real interviews.
Learn how to apply strategically, reach out to recruiters, and connect with professionals in your target companies.
Join thousands of learners mastering Excel, SQL, Tableau & Power BI
Data Analyst
"The structured curriculum and hands-on projects gave me the confidence to transition into a data analyst role. Within 4 months of completing the course, I landed my first analyst position."
Business Analyst
"Coming from a non-technical background, I was hesitant. But the clear teaching and real-world projects made everything click. I'm now working on business intelligence dashboards daily."
Operations Analyst
"The SQL and Excel modules were game-changers. I could immediately apply what I learned in my current role, which led to a promotion and 40% salary increase."
Financial Analyst
"The advanced Excel and Power BI modules helped me automate my reporting tasks. I now save 10 hours a week and present insights directly to stakeholders."
Data Engineer
"SQL was intimidating at first, but the step-by-step approach helped me master complex queries. I recently cracked a Data Engineer interview at a top MNC."
Marketing Analytics
"I learned how to visualize marketing data using Tableau. The portfolio projects I built during the course were exactly what my recruiters wanted to see."
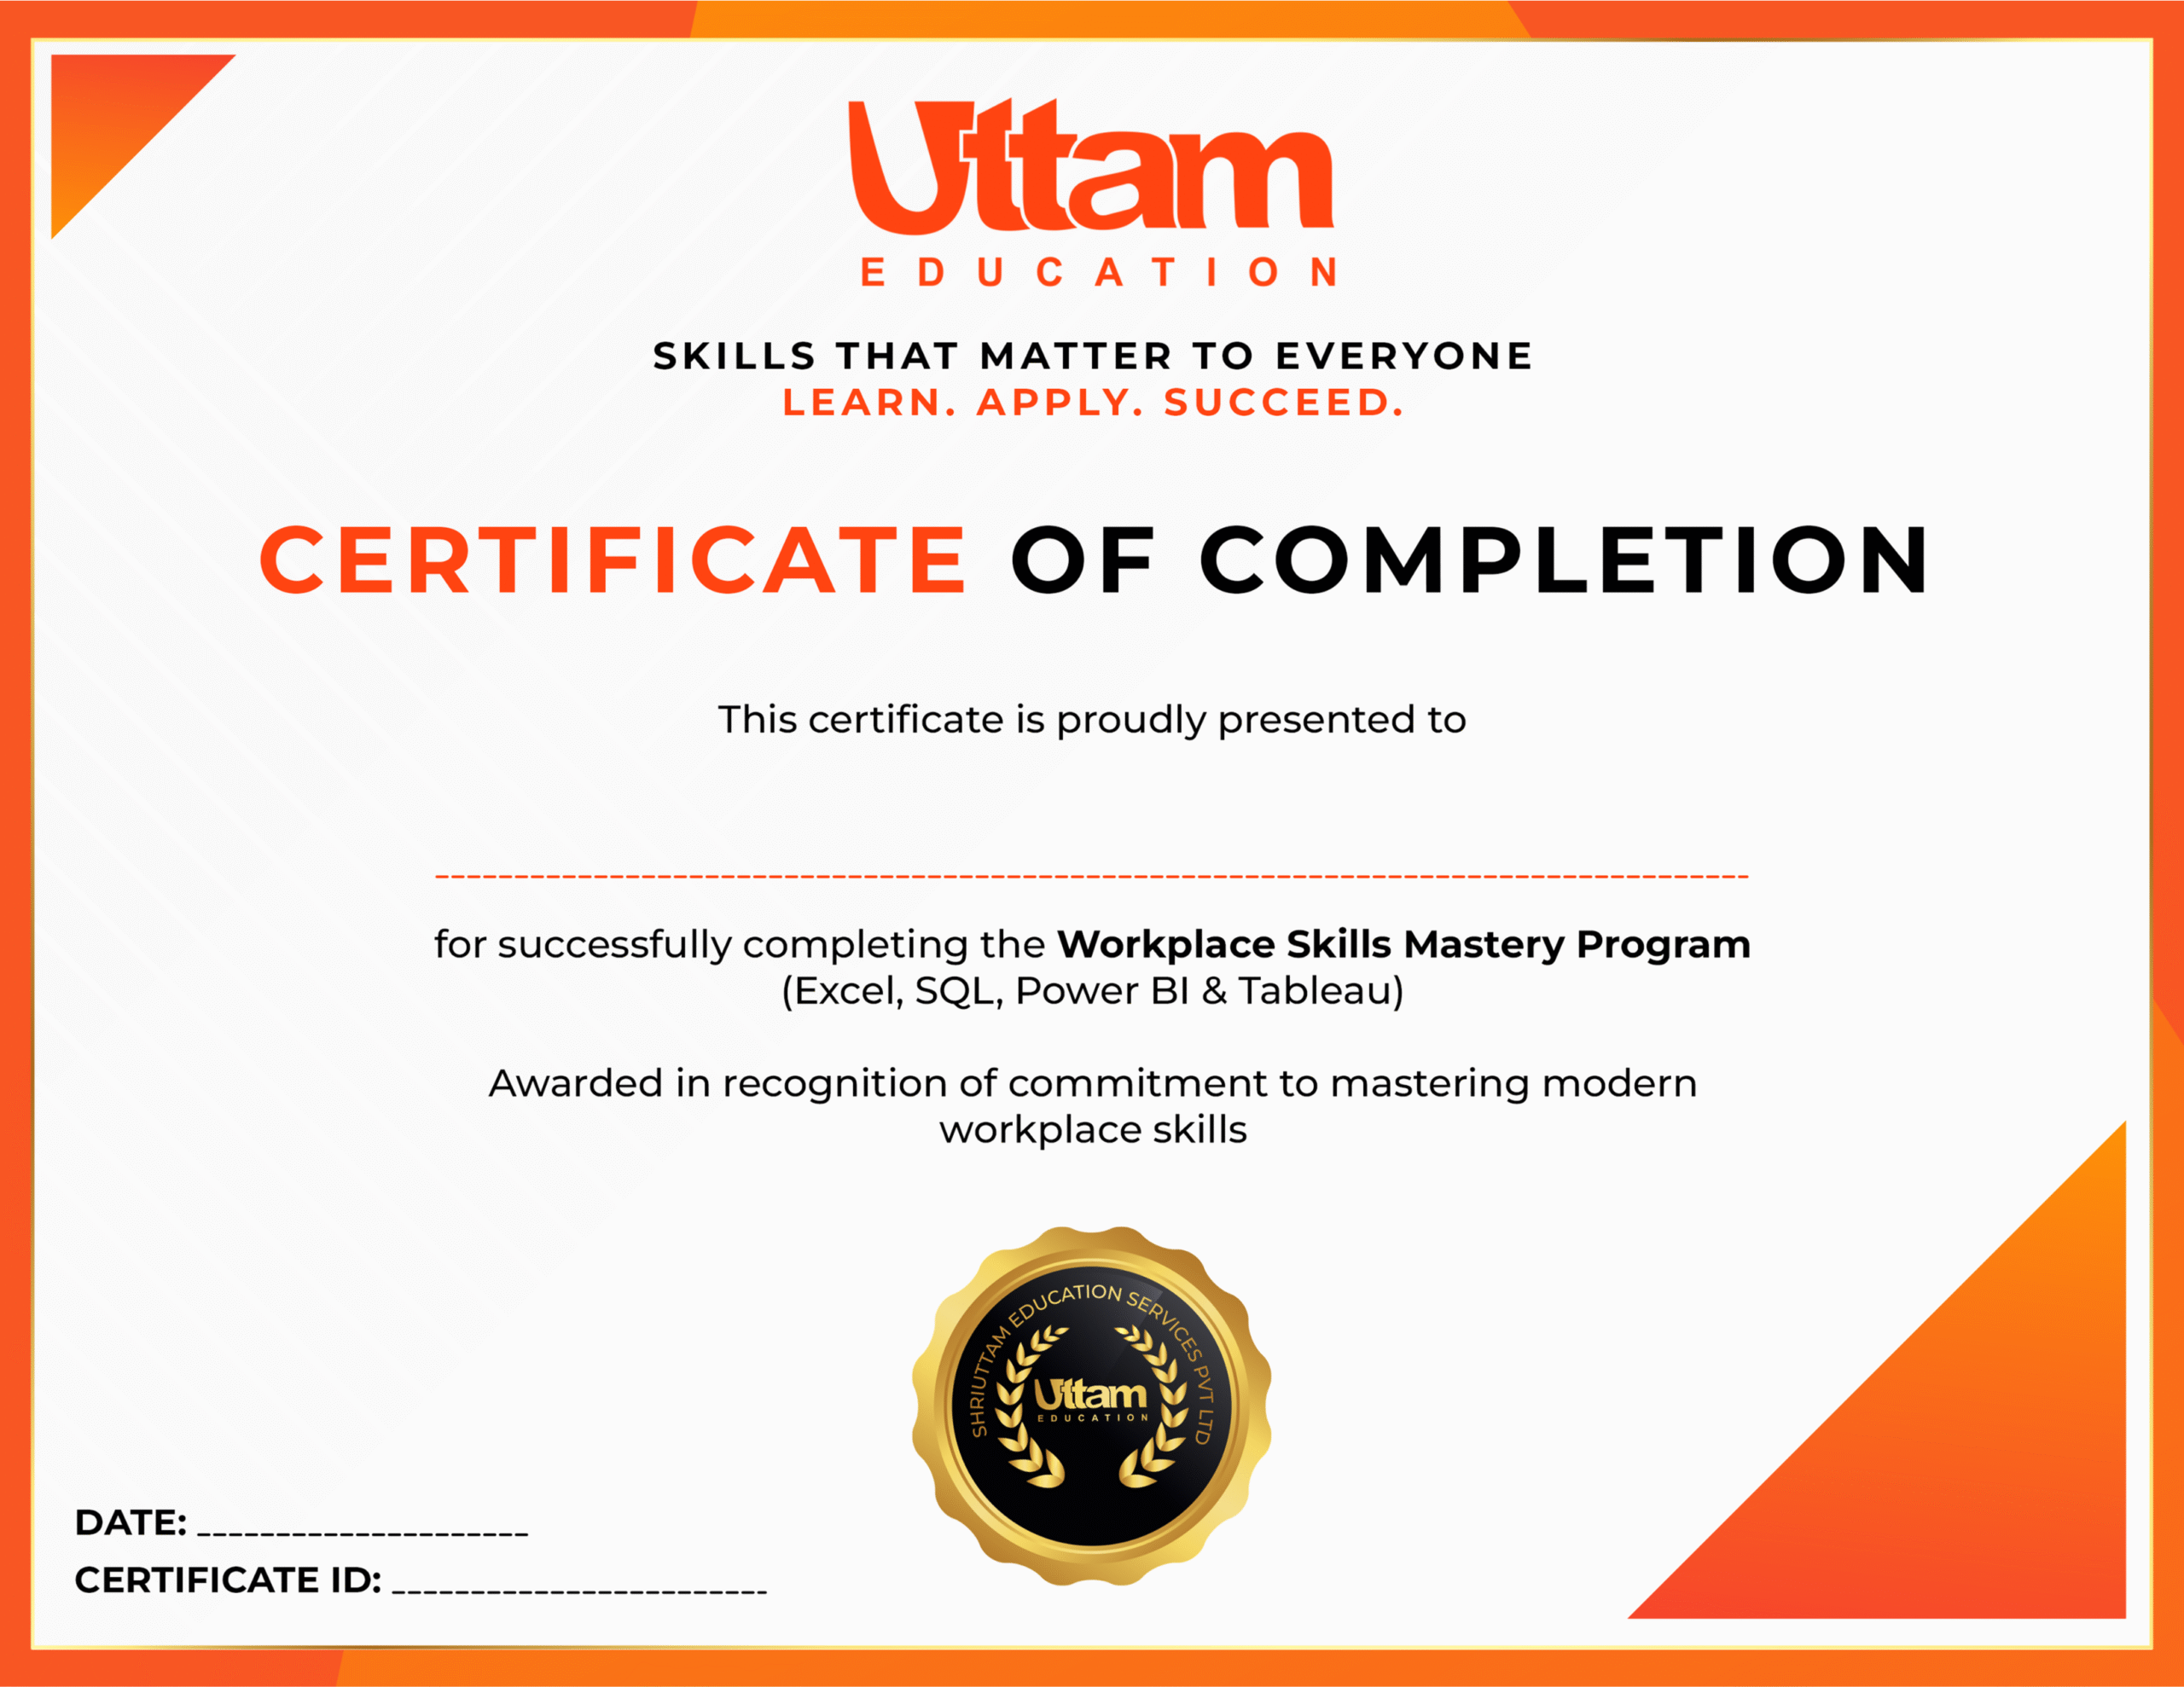
Showcase your achievement with a verified certificate recognized by top employers

Each certificate has a unique ID that employers can verify online.
Download high-resolution PDF or share digital version.
Add directly to your LinkedIn profile with one click.
Detailed list of all technologies and concepts mastered.
Trusted by 500+ companies in their hiring process.
Go through all course modules across Excel, SQL, Power BI, and Tableau with guided lessons.
Complete 20+ hands-on projects based on real business scenarios to apply what you learn.
Submit and review your final projects to demonstrate practical understanding and problem-solving.
Receive your verified Certificate of Completion, ready to share on LinkedIn and include in your CV.
Invest in your career with structured learning and long-term access
Everything you need to become job-ready in analytics
Program Fee:
₹14,999
(including GST)Admission Fee:
₹5,000
Balance Fee:
Pay within 20 days
ShriUttam Education Services Pvt Ltd,
Mantri Commercio, Outer Ring Rd, Devarabisanahalli, Bellandur, Bengaluru, Karnataka 560103
+91 8840-922-234
info@uttameducation.com